[29]:
import numpy as np
import cartopy

import matplotlib.pyplot as plt
import matplotlib.ticker as mticker
%matplotlib inline
Point data
[32]:
import pandas as pd
[2]:
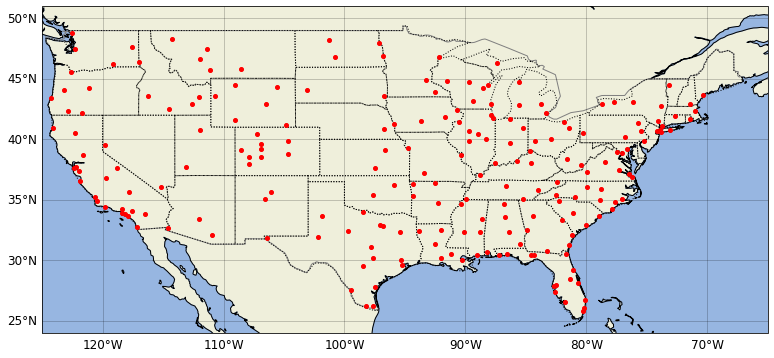
df = pd.read_csv('https://raw.githubusercontent.com/plotly/datasets/master/2011_february_us_airport_traffic.csv')
[36]:
df.head()
[36]:
| iata | airport | city | state | country | lat | long | cnt | |
|---|---|---|---|---|---|---|---|---|
| 0 | ORD | Chicago O'Hare International | Chicago | IL | USA | 41.979595 | -87.904464 | 25129 |
| 1 | ATL | William B Hartsfield-Atlanta Intl | Atlanta | GA | USA | 33.640444 | -84.426944 | 21925 |
| 2 | DFW | Dallas-Fort Worth International | Dallas-Fort Worth | TX | USA | 32.895951 | -97.037200 | 20662 |
| 3 | PHX | Phoenix Sky Harbor International | Phoenix | AZ | USA | 33.434167 | -112.008056 | 17290 |
| 4 | DEN | Denver Intl | Denver | CO | USA | 39.858408 | -104.667002 | 13781 |
[35]:
plt.figure(figsize=(13,6.2))

ax = plt.axes(projection=cartopy.crs.PlateCarree())

# Set lat/lon limit of map
ax.set_extent([-125, -65, 24, 51], crs=cartopy.crs.PlateCarree())

# Add features
ax.add_feature(cartopy.feature.LAND)
ax.add_feature(cartopy.feature.OCEAN)
ax.add_feature(cartopy.feature.COASTLINE)
ax.add_feature(cartopy.feature.BORDERS, linestyle='-', color='grey')
ax.add_geometries(cartopy.io.shapereader.Reader(cartopy.io.shapereader.natural_earth\
                                                (resolution='110m',category='cultural',
                                                 name='admin_1_states_provinces_lakes_shp')).geometries(),
                  cartopy.crs.PlateCarree(),facecolor='none',edgecolor='black',ls=':')

# Add lat/lon grid
gl = ax.gridlines(cartopy.crs.PlateCarree(), draw_labels=True, linewidth=1.0, linestyle='-', color='k',alpha=0.2)
gl.xlocator = mticker.FixedLocator(np.arange(-120,-60,10))
gl.ylocator = mticker.FixedLocator(np.arange(25,55,5))
gl.top_labels = False
gl.right_labels = False
gl.xlabel_style= {'size': 12, 'color': 'k'}
gl.ylabel_style= {'size': 12, 'color': 'k'}

# Add airport locations
ax.plot(df.long, df.lat, transform=cartopy.crs.PlateCarree(),marker='o', color='red', markersize=4, linestyle='')

plt.show()
/usr/local/lib/python3.6/dist-packages/cartopy/mpl/style.py:76: UserWarning: facecolor will have no effect as it has been defined as "never".
  warnings.warn('facecolor will have no effect as it has been '
[43]:
fig = plt.figure(figsize=(14,5))
ax = plt.axes(projection=cartopy.crs.PlateCarree())
# Set lat/lon limit of map
ax.set_extent([-125, -65, 24, 51], crs=cartopy.crs.PlateCarree())
# Add features
ax.add_feature(cartopy.feature.LAND)
ax.add_feature(cartopy.feature.OCEAN)
ax.add_feature(cartopy.feature.COASTLINE)
ax.add_feature(cartopy.feature.BORDERS, linestyle='-', color='grey')
ax.add_geometries(cartopy.io.shapereader.Reader(cartopy.io.shapereader.natural_earth\
(resolution='110m',category='cultural',
name='admin_1_states_provinces_lakes_shp')).geometries(),
cartopy.crs.PlateCarree(),facecolor='none',edgecolor='black',ls=':')
# Add lat/lon grid
gl = ax.gridlines(cartopy.crs.PlateCarree(), draw_labels=True, linewidth=1.0, linestyle='-', color='k',alpha=0.2)
gl.xlocator = mticker.FixedLocator(np.arange(-120,-60,10))
gl.ylocator = mticker.FixedLocator(np.arange(25,55,5))
gl.top_labels = False
gl.right_labels = False
gl.xlabel_style= {'size': 12, 'color': 'k'}
gl.ylabel_style= {'size': 12, 'color': 'k'}
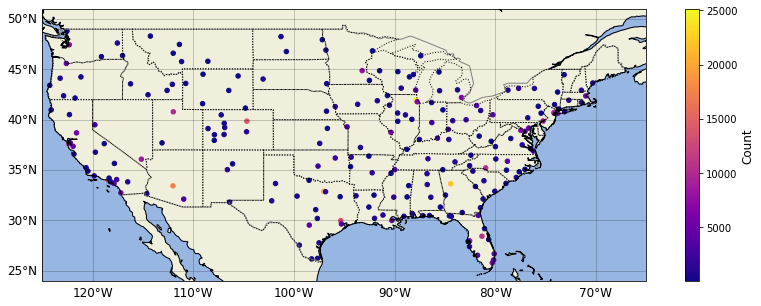
# Add airport locations with color showing number of arrivals
p = ax.scatter(df.long, df.lat, c=df.cnt, transform=cartopy.crs.PlateCarree(), s = 20, cmap = 'plasma')
cb = fig.colorbar(p)
cb.set_label(r'Count',fontsize=12)
plt.show()
Gridded data
[53]:
import xarray as xr
[56]:
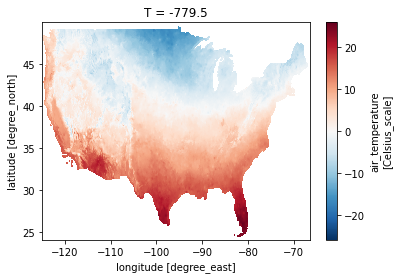
ds = xr.open_dataset("http://iridl.ldeo.columbia.edu/SOURCES/.OSU/.PRISM/.monthly/dods",decode_times=False)
[59]:
ds.tmax[0].plot()
[59]:
<matplotlib.collections.QuadMesh at 0x7f2c0c9a51d0>
[71]:
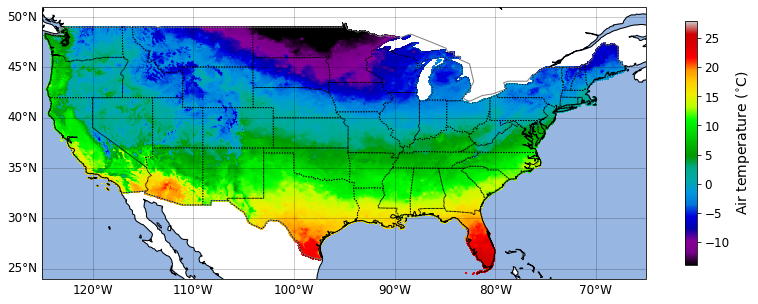
dx = np.unique(np.round(np.diff(ds.X),4))[0]
dy = -np.unique(np.round(np.diff(ds.Y),4))[0]
print('Grid spacing\n',dx,dy)
Grid spacing
 0.0417 0.0417
[75]:
fig = plt.figure(figsize=(14,5))

ax = plt.axes(projection=cartopy.crs.PlateCarree())

# Set lat/lon limit of map
ax.set_extent([-125, -65, 24, 51], crs=cartopy.crs.PlateCarree())

# Add features
ax.add_feature(cartopy.feature.OCEAN)
ax.add_feature(cartopy.feature.COASTLINE)
ax.add_feature(cartopy.feature.BORDERS, linestyle='-', color='grey')
ax.add_geometries(cartopy.io.shapereader.Reader(cartopy.io.shapereader.natural_earth\
                                                (resolution='110m',category='cultural',
                                                 name='admin_1_states_provinces_lakes_shp')).geometries(),
                  cartopy.crs.PlateCarree(),facecolor='none',edgecolor='black',ls=':')

# Add lat/lon grid
gl = ax.gridlines(cartopy.crs.PlateCarree(), draw_labels=True, linewidth=1.0, linestyle='-', color='k',alpha=0.2)
gl.xlocator = mticker.FixedLocator(np.arange(-120,-60,10))
gl.ylocator = mticker.FixedLocator(np.arange(25,55,5))
gl.top_labels = False
gl.right_labels = False
gl.xlabel_style= {'size': 12, 'color': 'k'}
gl.ylabel_style= {'size': 12, 'color': 'k'}

p = ax.pcolormesh(ds.X-dx/2, ds.Y-dy/2, np.ma.masked_invalid(ds.tmax[0]),
                  cmap='nipy_spectral', vmin=-14, vmax=28,transform=cartopy.crs.PlateCarree())

cb = fig.colorbar(p, orientation='vertical', shrink=0.9, ticks=np.arange(-10,30,5))
cb.ax.tick_params(labelsize=12)
cb.set_label(r'Air temperature ($^{\circ}$C)', fontsize=14)
plt.show()
[ ]: